

We Replaced 4 Hours of Weekly Reporting With One Slack Message - Here's How
This article explains how Syngulr's AI workforce platform revolutionizes weekly reporting by replacing a time-consuming four-hour manual process with a single Slack message that generates comprehensive, actionable reports in minutes.
 Krina Kumbhani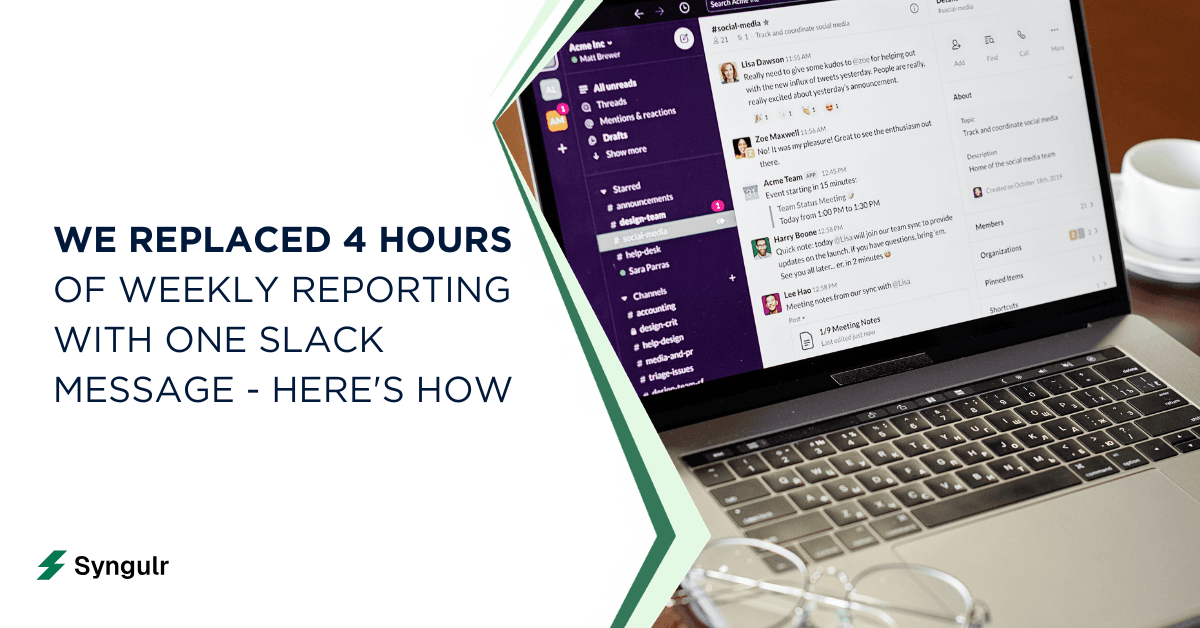
Every Friday at 2 PM, our marketing team used to disappear into a reporting black hole. Four people. Four hours. One PDF that half the leadership team skimmed and the other half ignored entirely.
The ritual looked the same each week: pulling numbers from Stripe, HubSpot, Google Analytics 4, and social media dashboards. Copy-pasting screenshots. Writing a brief summary of the past week. Formatting slides. Reviewing edits. Sending the whole thing to leadership with fingers crossed that no one would answer questions about a mismatched number.
Manual reporting is time consuming and inefficient. We knew it. Everyone knows it. But nobody fixes it because "that's just how reporting works."
Until we replaced the entire process with one Slack message.
Using Syngulr, our team now triggers a single command that builds an executive-ready weekly status report in under three minutes. No screenshots, no copy-paste, no Friday fire drills. This article walks through what an effective weekly report actually is, why most teams over-invest time building them, the core templates you need, and exactly how to compress the whole workflow into one automated message - with specific dates, real tools, and actual numbers.
What Is a Weekly Report in Modern Teams?
A weekly report is a short, structured overview of work done, results achieved, and plans for next week - optimized for fast decision making. A typical weekly report is one page long and covers three time horizons: past, present, and future.
In 2026, weekly reports usually combine key metrics from tools like CRMs, analytics platforms, and ad dashboards with narrative context from team members. The goal is not just "what" but "why" and "what next."
Core components include a clear timeframe, completed tasks, ongoing work, blockers, and a concise report summary that leadership can read in under two minutes. A weekly report typically includes past, present, and future sections, making it easy for anyone to quickly assess the week's performance and the plan for the coming week.
Where teams once relied on one-page emails, richer formats have emerged: dashboards, an infographic weekly report template layout, and AI-generated PDF briefs. Syngulr's AI workforce treats the weekly report as a living document that updates automatically as data changes, instead of a static Friday artifact that's outdated before Monday.
The Real Purpose of Weekly Reporting (Beyond "Keeping Your Boss Updated")
Weekly reports help track team performance and productivity - but that's the floor, not the ceiling. The real job of a weekly status report is threefold:
- Align teams on priorities so everyone knows what matters this week
- Turn raw data into decisions by surfacing actionable insights
- Catch issues early before they become expensive problems
Weekly reporting identifies problems early, surfacing delays and resource shortages before they spiral. Research from OKRs Tool found that teams maintaining consistent weekly check-ins complete 43% more goals than those relying on monthly or ad-hoc reviews.
Effective weekly reporting can increase team focus and task prioritization. It improves team focus by aligning tasks with company goals. Regular feedback from weekly reports also boosts employee satisfaction, because employees can see how their work connects to the bigger picture.
Stakeholder needs differ. Executives want a high level overview. Managers want weekly progress detail. Individual contributors want visibility on how their ongoing work matters to the department and company. Syngulr's AI agents act as reporting translators, converting dense data into role-specific insights without extra human effort. One report, multiple perspectives - automatically tuned.
Weekly reports promote transparency, accountability, and continuous improvement across every team.
What Goes Into an Effective Weekly Report?
An effective weekly report should be brief and focused on outcomes rather than activities. The structure follows a simple rhythm: Past (results from last week's work), Present (status of ongoing projects), and Future (plan for the upcoming week).
Key components of a weekly report include accomplishments, KPIs, challenges, and next steps. Here's what belongs in each:
- Results: tasks completed, notable achievements, key metrics with week-over-week comparisons
- Status: ongoing work, blockers, risks that need escalation
- Plan: priorities for the following week, decisions needed from leadership, resource asks
Reports should summarize completed tasks and ongoing projects without burying readers in task-level minutiae. Including challenges faced and solutions is essential in reports - yet identifying challenges and solutions is often overlooked. Risks and blockers should be documented for proactive problem-solving.
A future overview section outlines tasks for the upcoming week, giving managers a clear signal of where the team's focus will be. Most weekly reports are one page long for brevity. Use simple language, separate sections with clear headers, and keep the layout scannable.
Syngulr standardizes these elements across teams so a sales weekly report, an engineering status report, and a social media performance report all feel familiar to anyone in the company.
From 4 Hours to One Slack Message: The Before & After
Here's how the before looked for our growth marketing team during the week of June 3–9, 2026:
| Activity | Tools | Time |
|---|---|---|
| Pulling ad metrics | Google Ads, Meta Ads, LinkedIn Ads | 45 min |
| Social media and analytics data | GA4, Instagram, X, LinkedIn | 30 min |
| Email and revenue metrics | Klaviyo, Salesforce, Shopify | 30 min |
| Writing narrative summary | Google Docs | 60 min |
| Screenshots and formatting | Slides / PDF | 30 min |
| Review, edits, send | Slack / Email | 30 min |
| Total | ~3.75 hours |
That's nearly half a work week day spent on record keeping instead of strategy.
The after with Syngulr: a single Slack command - /syngulr weekly marketing report for June 3–9, 2026 - triggers an AI reporting agent. It pulls data via APIs, applies your weekly report template, generates charts, writes a brief overview of the week's work, flags anomalies (e.g., "CTR down 15% on LinkedIn Ads"), and posts both a PDF and a Slack-native summary thread.
Time: under 3 minutes. The Handover case study showed a similar transformation - from four hours to ten minutes, a 96% reduction in reporting time. A separate Boosha AI deployment in the energy sector cut weekly report prep from 6–8 hours to 1–2 hours, freeing roughly 300 hours per year.
Secondary benefits: fewer errors, no unnecessary stress on Fridays, easier week-over-week comparisons, and consistent communication across the department.
The Core Weekly Report Templates You Actually Need
Most teams only need a small set of reusable weekly report templates instead of starting from zero each Friday. Weekly report templates streamline the reporting process and templates help maintain a uniform design across reports.
Four core types cover nearly every function:
- A basic weekly report template - works for any team, any role
- A KPI weekly report template - metrics-first for data driven functions
- An executive summary weekly report - leadership-level brief overview
- A social media performance report - channel-specific weekly updates
Syngulr hosts these templates centrally and applies them automatically to each team's data sources. They can be exported or rendered as PDFs, Google Docs, Notion pages, or Slack-native formats depending on stakeholder preference.
The AI agents respect your structure, naming, and sections rather than imposing generic layouts. Your team keeps its voice; Syngulr handles the assembly.
Template 1: Basic Weekly Report Template for Any Team
A basic weekly report template works for most roles and covers the essentials without visual complexity. Basic weekly report templates include sections for tasks completed and challenges. Here's the structure:
- Title and date range (e.g., "Marketing Weekly - June 3–9, 2026")
- Owner (who is responsible)
- Brief summary (2–3 sentences on the week's biggest takeaway)
- This Week - briefly describe what was accomplished, using bullet points
- Challenges - what blocked progress and how the team tried to address challenges
- Next Week - priorities and new projects kicking off
Example items under "This Week" might read: shipped onboarding v2, closed the ACME renewal, published the Q2 social media posts content calendar, and saw significant progress on the product redesign.
Syngulr's AI agent can auto-populate this template by reading tasks from tools like Jira, Asana, HubSpot, and GitHub. It pulls completed tasks in chronological order, identifies blockers from ticket comments, and drafts the summary in simple language.
This template is ideal for cross-functional check-ins, 1:1s, and team-wide Slack updates where clarity matters more than depth. It lets managers and team members stay informed without sifting through dashboards. Think of it as a brief summary that lets anyone brainstorm ideas for the following week based on what actually happened.
Template 2: KPI Weekly Report Template for Data-Driven Teams
A KPI weekly report template is a structured, metrics-first view for functions like growth, sales, support, and product. KPI weekly report templates summarize key performance indicators weekly, giving everyone a data driven snapshot of overall performance.
The layout starts with a short intro, then moves into KPI blocks:
| Metric | This Week | Previous Week | Target | WoW Change | Owner |
|---|---|---|---|---|---|
| Revenue | $142K | $138K | $150K | +2.9% | Sarah |
| MQLs | 312 | 290 | 300 | +7.6% | James |
| Signup Conversion | 3.8% | 4.1% | 4.5% | -7.3% | Dev Team |
| Social Media Engagement | 4.2% | 3.9% | 4.0% | +7.7% | Content |
| Website Traffic | 48K | 45K | 50K | +6.7% | SEO |
Each KPI includes a comment line and an action plan statement. For example: "If signup conversion stays below 4%, test new pricing banner next week." This ensures every metric points to a decision, not just a number. Product performance, customer metrics, and pipeline health all get tracked in one view.
Syngulr's agents read from your CRM, data warehouse, ad platforms, and analytics tools to fill these sections automatically. They highlight where the team made significant progress and flag where performance dipped - giving managers what they need to make informed decisions and answer questions from leadership without digging through five dashboards.
Template 3: Infographic and Visual Weekly Reports (When You Need to Impress)
An infographic weekly report template uses clean visuals, iconography, trend arrows, and compact metric cards instead of dense text. It's the format you reach for when the audience extends beyond your immediate team.
Common use cases:
- Board or investor updates
- Client-facing agency reports
- Internal "state of growth" memos for all-hands meetings
- Cross-department weekly updates where you need to save time and maximize clarity
Syngulr's AI design capabilities can auto-generate these visuals from a data model, keeping colors and typography on brand. Under the visuals, there's still a concise report summary and a bullet-point action plan for next week - ensuring it's not "pretty but empty."
Teams can maintain both a simple internal basic weekly report template and an external-facing infographic view powered by the same dataset. Same data, different delivery - without doubling the effort.
The key: these reports still need to answer questions. Visual flair means nothing if it doesn't help leadership track the week's performance at a glance and make decisions about the coming week.
Automating Weekly Reports With Syngulr AI Employees
Syngulr's AI workforce concept means specialized AI employees - reporting analysts, marketing ops agents, finance analysts - own your recurring weekly reporting tasks. They're not one-off scripts or templates. They're persistent agents that learn your structure, respect your preferences, and run 24/7.
Here's the workflow:
- Data collection - agents connect to CRMs, billing tools (Stripe), ad platforms (Meta, Google, LinkedIn), social media dashboards, Google Sheets, project management tools, and internal databases
- Transformation - raw data is cleaned, aggregated, and mapped to your weekly report template fields
- Insight generation - agents detect anomalies, calculate week-over-week changes, and flag items needing attention
- Narrative writing - a brief summary and section commentary are generated in your team's voice
- Delivery - the finished report lands in Slack, email, or Notion on schedule
Quality controls include logs showing which sources were used, links back to underlying dashboards, and feedback loops that retrain agent behavior over time. A well-structured weekly report can streamline communication within teams, and automation enforces that structure consistently.
Unlike generic workflow tools, Syngulr agents can also execute the action plan steps directly from insights. If a report flags a drop in website traffic, the agent can create a Jira ticket for investigation, schedule a follow-up experiment, or notify the relevant team members - closing the gap between reporting and doing.
A manufacturing leader using AI-powered BI reclaimed 22 hours weekly by automating cross-system report building. Syngulr applies that same principle across every department in your company, not just analytics.
From Data to Decisions: Building an Actionable Weekly Report Summary
The difference between a useful weekly report and a forgettable one is the summary at the top. Here's how to transform a pile of numbers into a brief summary any exec can act on in 60 seconds.
Best practices for weekly reports include keeping the format consistent and focusing on outcomes. Structure it like this:
- 3 key insights (what the data is telling you)
- 3 wins (notable achievements worth highlighting)
- 3 issues (where the team needs to address challenges)
- 3-item action plan for next week with owners and due dates
Concrete example for the week of May 5–11, 2026:
"CAC up 12% on Meta Ads due to increased CPMs - pausing two underperforming ad sets. Demo requests flat at 45 despite higher traffic - testing new CTA copy. Organic social media reach up 18% after launching the new content cadence; doubling down on LinkedIn video."
Syngulr prompts its AI agent to always answer "So what?" and "Now what?" for each KPI, not just restate the metric. This turns raw weekly progress data into actionable insights that drive decision making. Weekly reports provide a snapshot of employee productivity and they help managers assess employee performance effectively - but only when the summary tells a story, not just lists numbers.
Place this report summary at the very top of every weekly report template. Stakeholders who only have 60 seconds get what they need. Those who want depth can scroll into the separate sections below.
Best Practices and Pitfalls in Weekly Reporting
Even with great templates, weekly reporting can go wrong. Here are the most common mistakes:
- Bloated reports: cramming every task and metric into one document instead of a focused high level overview
- No clear action plan: listing data without telling anyone what to do about it
- Inconsistent date ranges: mixing "Monday to Friday" with "Saturday to Friday" across teams
- Unverified data: weekly reports often face issues with data accuracy when numbers are copy-pasted across tools
- Ignoring qualitative progress: experiments, learnings, and customer feedback matter alongside KPIs
And the practices that actually work:
- Fixed send time (e.g., every Monday 9:00 AM) so employees don't struggle to meet weekly reporting deadlines
- Standardized sections across department reports
- Consistent naming of weeks and key metrics
- Both qualitative narrative and quantitative data in every report
- A clear action plan with owners - not vague "we should look into this" statements
Lack of clarity in reporting objectives can hinder effectiveness. Before automating anything, define what each report is for and who needs it. Weekly reports can identify operational inefficiencies in teams and highlight operational inefficiencies quickly - but only if the right metrics are being tracked.
Syngulr agents can be configured to flag anomalies (e.g., traffic drops greater than 25%) and request human validation before sending the final status report. This prevents the overconfidence risk of fully automated outputs while still letting teams generate reports quickly.

How to Implement "One-Message Weekly Reporting" With Syngulr
Here's a concrete implementation plan, using an example company starting in August 2026:
Step 1: Audit your current workflows. Map which tools each department uses, which key metrics get pulled, and how the weekly updates currently reach leadership. Identify the most time consuming report first.
Step 2: Define your templates. Choose from the core set - basic weekly report template, KPI weekly report template, executive summary, or social media performance report. Decide what goes in each and who receives it.
Step 3: Connect your data sources. Syngulr integrates with Stripe, HubSpot, GA4, Meta Ads, Google Ads, LinkedIn Ads, Shopify, Jira, and more. Set up API connections and verify data accuracy.
Step 4: Configure Slack commands. Set up slash commands or scheduled cron triggers so reports generate automatically every Monday morning or on demand.
Step 5: Test with one team. Start with your marketing team. Run the automated report alongside your manual process for two weeks. Compare output, fix gaps, calibrate narrative tone.
Step 6: Scale across the company. Once the pattern is proven, expand to sales, customer success, product, and finance. Each department keeps its own template while leadership gets a consolidated brief overview of the company's weekly status.
Step 7: Monitor and improve. Track time saved, report accuracy, and stakeholder satisfaction. Use feedback to retrain agent behavior and evolve templates as new projects or metrics emerge.
Weekly reporting isn't going anywhere. It's how teams stay informed, how managers track progress on projects, and how leadership makes informed decisions about the plan for the following week. But spending four hours each work week assembling one report when AI agents can do the job in minutes - that part is going away fast.
The question isn't whether to automate your weekly reporting. It's whether you'll do it this quarter or keep burning hours on a process that should take one Slack message.
Ready to see it work with your data? Bring your existing weekly report template - basic, KPI, infographic, whatever you use - and join waiting list of Syngulr. We'll connect your tools, apply your template, and show you what your next weekly report looks like when it builds itself.
Related articles

AI Tools and Automation
Google AI Search: How AI Overviews and Search Labs Are Changing Google Search
Google AI Search blends web search with generative AI to deliver cited, synthesized answers through AI Overviews and AI Mode. Learn how it works, how to enable Search Labs on desktop and mobile, its real impact on SEO and traffic, and where AI-powered search is heading next in 2026.

AI Tools and Automation
Artificial Intelligence Code: Modern AI Coding Tools, Code Generation & Business Automation
AI-generated code has moved from novelty to the core of how teams ship software. Learn what artificial intelligence code is, how AI writes code from prompts, the top AI coding tools, when to trust it versus humans, and how Syngulr builds AI employees on AI-generated, human-reviewed code.

AI Tools and Automation
AI and Digitalization: How Artificial Intelligence Is Powering the Next Wave of Digital Transformation
Learn how AI and digitalization work together to reshape business operations, improve decision-making, and unlock measurable growth. A practical guide for leaders ready to drive effective digital transformation.
Build your AI workforce today
Put everything you just read into practice. Spin up AI employees for your business in minutes — no credit card required to start.